
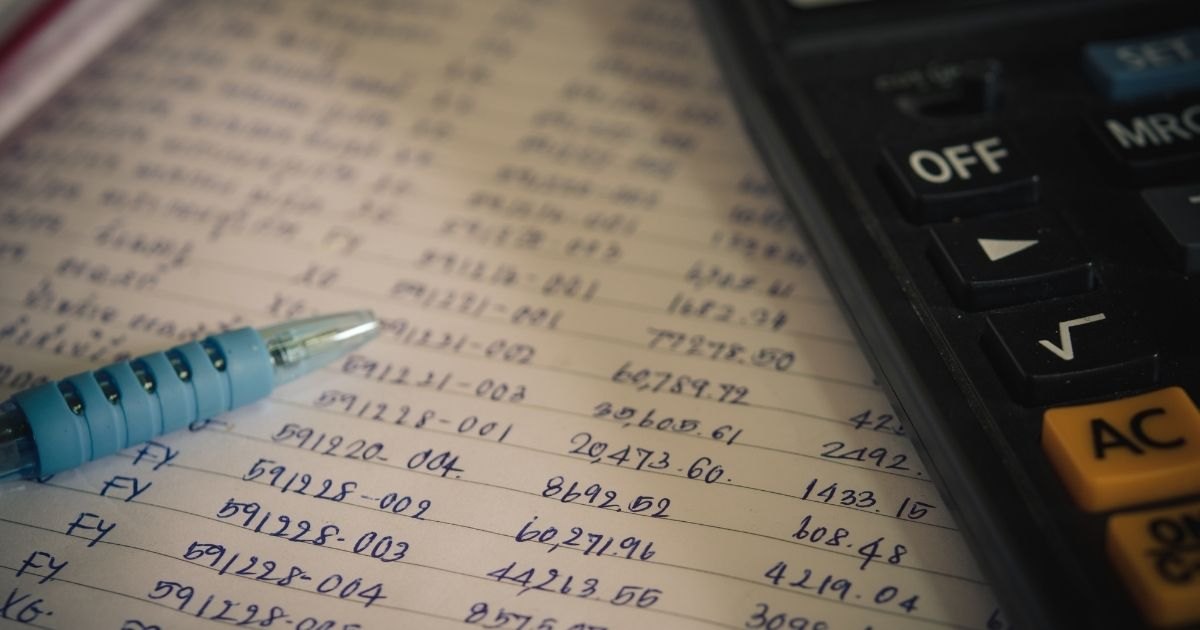
You present a report at a meeting showing that most requests were handled. A colleague opens a different spreadsheet and says the result is much worse. You both have figures in front of you, but the discussion quickly turns into an argument about whose numbers to trust. The first step is not to decide which colleague is more credible. It is to find out whether the figures measure the same thing.
Different results do not necessarily mean there is an error or that someone has been dishonest. They may reflect different definitions, time periods, filters or update schedules. Sometimes, however, they do point to a calculation error. The steps below can help you tell the difference before changing a plan or evaluating someone’s performance based on a disputed report.
Start with the decision, not the spreadsheets
Before checking the figures, write down one sentence: What decision are we going to make based on this number? You need a different level of accuracy to get a general sense of workload than to pay bonuses or make a commitment to a customer. If you do not know what decision the figure is meant to support, you could spend hours investigating a discrepancy that does not matter to the question at hand.
Suppose you are trying to determine whether a department needs another employee. The number of requests received shows incoming work, the number closed shows output, and the number still open at the end of the day shows the remaining workload. These figures are not interchangeable, even though they all describe the same operation.
Three short questions can help: What exactly do we need to know? For what date or period? What decision would change if the result were higher or lower? The answers define the scope of your review and help you focus on discrepancies that actually matter.
Five reasons the same metric can produce different results
When two reports have the same title, it is easy to assume they contain the same information. But even a small difference in which records are included can change the result. Before looking for an error in a formula, compare five basic characteristics.
- Definition: Does “completed” mean answered, closed in the system or confirmed by the customer?
- Time period: Does one report cover the calendar month and the other the past 30 days? Do they use the same time zone?
- Scope: Do both reports include all locations, products and teams? Does one exclude cancelled cases?
- Unit and base: Is the figure a count, percentage or average? If it is a percentage, is the denominator the same?
- Update schedule: Is one figure from yesterday’s export and the other from today’s live system?
The calculation base deserves particular attention. Saying that 80% of cases were successful means something different when there were 20 cases than when there were 2,000. Without the denominator, you do not know how many cases the percentage represents. An average can also be misleading if a few unusually large items have a major effect on the result.
Create a one-page comparison sheet
You do not need to build a new system or copy hundreds of rows. A short working sheet with two columns for the sources and a third for the difference you find is enough. For each figure, note where it comes from and who can explain how it was produced. This is also useful for teams because it separates verifiable facts from assumptions.
| What to compare | What to check | Possible next step |
|---|---|---|
| Name and definition | What counts as a completed item? | Write down one shared definition. |
| Time period | Which dates and cut-off times apply? | Recalculate for the same interval. |
| Records included | Which categories, statuses or locations were excluded? | Align filters and exceptions. |
| Calculation method | What is used as the numerator, denominator or average? | Check the formula against a small sample. |
| Source and update | Where does the figure come from, and when was it refreshed? | Use comparable versions of the data. |
If you find a blank, do not fill it with an assumption. Write “unknown” and note the exact question to ask the system administrator or report author. An unknown filter is a specific gap in your understanding, not proof that the other report is wrong.
Check individual records, not just the totals
Once the basic definitions appear to match, select a few records and trace each one from the original event through to the report. For example, choose a typical order, a cancelled one, an incomplete one and one updated after the reporting cut-off. A small sample cannot prove that the whole system is correct. Its purpose is to show you where the data stop matching.
For each record, check its identifier, event date, current status, any status changes and whether it appears in both outputs. If the same item appears twice in one spreadsheet, it may be a duplicate. If it is missing, the cause could be a filter, a delayed transfer or a different rule for including records. Do not automatically select only the cases that support your first guess.
A worked example with order deliveries
Imagine an online store that records 100 orders during a selected period. Its operations report shows an 82% success rate, while its customer overview shows 69%. The dispatch manager says the problem is not serious; a support employee points out that customers are waiting for their parcels. Who is right?
The review shows that the first report counts 82 orders marked as handed over to the carrier. The second counts 69 orders for which the system already records confirmed delivery. The difference of 13 orders does not, by itself, mean parcels have been lost or work has been done incorrectly. It means that, in this report, delivery has not yet been confirmed for 13 of the orders handed over to the carrier.
If the team wants to assess dispatch speed, handover to the carrier is a relevant measure. If it wants to promise customers a delivery date, it needs data on actual delivery, including delays and possible exceptions. One figure does not have to replace the other. The reports may both be correct while answering different questions.
The team should name the two metrics separately, state when each was measured and check the status of any orders that remain open. Only then can it decide whether to strengthen dispatch, customer communication or work with the carrier. Without this distinction, the team could end up solving the wrong problem.
How to discuss the figures as a team without competing over who is right
When figures do not match, people often become defensive. The report author may take a challenge as criticism of their work, while someone in operations may see the spreadsheet as out of touch with reality. A productive discussion needs rules that apply equally to everyone.
- Separate the claim from the person: Say “this spreadsheet includes cancelled orders,” not “you calculated it incorrectly.”
- Ask for the exact method: Instead of “Where did you get that?”, try “Which records and formula produced this result?”
- Write down shared facts: Separate what you agree on from open questions. You can return to the agreed facts as the discussion continues.
- Allow for two useful metrics: Not every discrepancy has to end with one winning number.
When new information appears, do not dismiss it as an exception
Your analysis may uncover information that challenges your initial understanding: an unusually large order, a record with an atypical status or a change in methodology partway through the month. The first impulse may be to ignore it or quickly revise the entire assessment. Neither response is necessarily appropriate.
First, check whether it is a recording error, a legitimate exception or a change in the rules. Correct an error at its source and document the correction. Do not remove a genuine exception just because it affects the result; make it visible instead. Keep a methodology change separate so that comparisons with previous periods do not appear more precise than they really are.
If you have a deadline for delivering the report, prepare a provisional result and clearly state what remains uncertain. For example: “The difference is still unexplained for eight records, so we are not confirming the final percentage.” That is more informative than a rounded figure with no caveat. Also specify who will review the open cases and by when.
Three mistakes that can needlessly prolong a review
The first is looking for someone to blame before finding the cause of the discrepancy. That prompts people to defend themselves rather than explain what happened. Even if a report is wrong, the team needs to know which rule or record caused the error and how to prevent it from happening again.
The second is checking everything at once. If two totals do not match, start with the definition, time period and a small set of records. Expand the review only if those checks do not explain the difference. However, a small sample is not enough for a high-stakes financial, legal or safety decision. The review should match the level of risk and may require a professional audit.
The third is quietly changing the rules during the review. If you choose a metric first and then change its definition after seeing the result to make it look better, it is no longer a reliable basis for decisions. Methodology changes are sometimes necessary, but they should be documented, and old and new periods should be separated where possible.
A quick check before your next meeting
When two figures do not match, prepare a simple record of your review. You can use it for budgets, request handling, team performance or project results. Always use only data you are authorized to access.
- State the decision: What should the team do based on the figure, and why does it matter?
- Align the meaning: Agree on the metric’s definition, time period, included records and calculation.
- Locate the discrepancy: Compare a few specific records and identify the first rule that differs.
- Record what is known: What is confirmed, what is only an assumption, and what still needs checking?
- Agree on the output: Which figure answers the question, how should it be labelled, and who will arrange any necessary correction?
Analytical skill does not always mean finding one perfectly precise number. It means being able to explain what the number represents, what its limitations are and which decisions it can support. At your next meeting, start with that explanation, then present the result.


